Experiment: Explain an example of when the “worst case scenario” actually happens
It is a common perception that statisticians are liars. Statistics lie! Or, more accurately, it is easy to hide the truth through poor reporting of statistics. The statistical methods behind John Hattie’s “visible learning” series may be hiding the significant flaws in the research and may overstate how well the findings can be generalized to a school setting.
If you’re new to my series on distortion, check out Chapter 1 and Chapter 2!
The statistic that Hattie has used to demonstrate his meta-analysis findings is “Effect Size”. He makes far too many leaps in judgement for my taste which makes me very skeptical about how robust his findings really are.
Three common criticisms I’ve seen of effect size are:
- Mathematicians don’t use it
- Mathematics textbooks don’t teach it.
- Statistical packages don’t calculate it. (Didau, 2014)
The most common usage of “Effect Size” is in meta-studies of healthcare outcomes. We tend to think of education and healthcare as rather similar (both are care work, we are remediating and preventing problems, nurses or doctors seem fairly equivalent to teachers in many ways) but the outcomes are extremely different! In healthcare, easy to measure outcomes like mortality rate or length of hospital stay are obvious, clearly quantifiable, and equivalent across settings. Education is a much more disputed field. Who gets to decide what “academic achievement” is? Children don’t leave school when they reach a certain level of academic quality and then come back when they have problems in the way would we expect in healthcare settings. We expect teachers to constantly improve the excellence of students in a variety of academic, emotional, social, and physical areas. Hattie uses the outcome of “academic achievement” but maybe the similarities are not strong enough to justify this as an appropriate use of effect size statistics!
Let’s look at a couple of the leaps.
Here is the distribution of all of the effect sizes from his study (side note: Another issue is that Hattie chose which attributes and interventions to look at in a positive way. He did not seek out all the meta-studies about attributes of schools or interventions that are obviously detrimental to academic achievement, e.g. school shootings. But I digress . . .). A few have negative effects, most have effect sizes between 0 and 1. An effect size of 1 is discussed as equivalent to advancing a the achievement of a student by a year or increasing learning by 50%.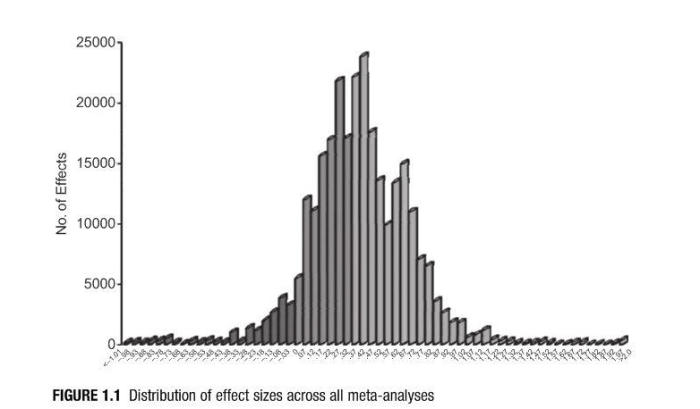
(Hattie, 2012, p. 2)
Looking at the attributes of schools and interventions that improve academic achievement, Hattie takes us on the journey of “everything seems to work” (Hattie, 2009, p. 2) except a few things. If most everything works, then I might argue that schools are fine and we should make sure that teachers have the chance to work together to create spaces where improvement continues. But that’s not enough for Hattie, he wants all students to be better than ever! Best possible! Unfortunately, he doesn’t want to actually go through the complex statistical analysis of removing the influence of teachers, home, or time on students although it is technically possible. So, he sets a rather arbitrary effect size barrier of 0.4 (the average of all of the meta-analyses he looked at) with the justification that anything between 0 and 0.4 (so, below the average effect size of what he studied) must be due to the effects that he just doesn’t want to bother with. Here is a colored version of those barriers.
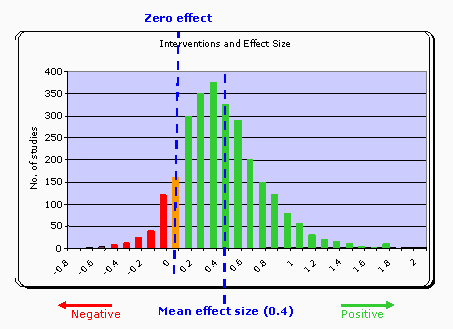
(Atherton, 2013) Atherton asks that you excuse the mis-alignment of the numbers. The 0 corresponds to the orange bar and the 0.4 to the blue dotted line on the right.
Below is the graphic that covers Hattie’s books. I’ll include it just because it is such an obvious form of distortion. Why is 0 to 0.2 yellow? Warning? There is some positive effect here! Interventions such as team teaching, audio-visual aids, and school finances exist in this zone. (here is the table of effect sizes again if you want to see what “makes the grade”)
It is absolutely distortion to color those yellow, the (perhaps unintended) message is that these are things teachers should avoid!
I actually think Hattie would dispute the idea that we should avoid the interventions that are on the low end of his scale. John Hattie himself goes to lengths to discuss what is not visible and how his research doesn’t reflect actual classrooms, almost to the point of saying that you should not simply implement the book into a school. But I have seen too much over-simplification of this research. I will attribute the blame to the author, who presents his material in a way that is too easily misinterpreted. Adding his misgivings in the narrative sections of the book, while the visuals are color-coded so poignantly is distortion, plain and simple.
Other sites report this even more staggeringly. Here’s the key to a huge spreadsheet compiled by an education consultants agency. Those same lovely interventions of team teaching and visual aids would be colored red!! Avoid at all costs! Warning!

(Sorenson)
Now, here’s the interesting part. Where distortion really comes into play. Hattie himself states that there are significant limitations to looking at effect size only (2009, p. 9). He acknowledges that he cannot make any claims that the interventions with high effect sizes will make a difference to all students. Unfortunately, distortion comes naturally with how researchers like John Hattie see the world. More on this next time!
Atherton J S (2013) Learning and Teaching; What works best [On-line: UK] retrieved 5 January 2016 from http://www.learningandteaching.info/teaching/what_works.htm
Didau, D. (2014, 2014-01-24). Old Hat(tie)? Some things you ought to know about effect sizes – David Didau: The Learning Spy. Retrieved from http://www.learningspy.co.uk/myths/things-know-effect-sizes/
Hattie, John. (2012). Visible Learning for Teachers. Routledge. Retrieved 6 January 2016, from <http://www.myilibrary.com?ID=363783>
Hattie, John. (2009). Visible Learning: A synthesis of over 800 meta-analyses related to achievement. Routledge.
Sorensen, B.H. http://www.learningandteaching.info/teaching/what_works.htm


Pingback: Distortion – Chapter 4 | winchip
Pingback: Distortion – Chapter 5 | winchip
Pingback: Distortion – Chapter 6 | winchip